
Assembly
In reverse engineering challenges, understanding assembly is essential to analyze compiled executables and recover program behavior. By viewing compiler output from short snippets, you can quickly learn how code constructs translate into CPU instructions, an important skill in static analysis and binary reversing.
- Interactive compiler tool: Compiler Explorer
- Common compilers:
gcc,clang,msvc - Disassemble binaries:
objdump -d <binary> | less
| Tool | Purpose |
|---|---|
| Compiler Explorer | Compare high-level code to generated assembly across compilers |
objdump |
Disassemble binaries to examine CPU code |
ndisasm, radare2, ghidra |
Additional low-level disassembly analysis |
Open Compiler Explorer. Enter the following sample code:
int square(int num) {
    return num * num;
}
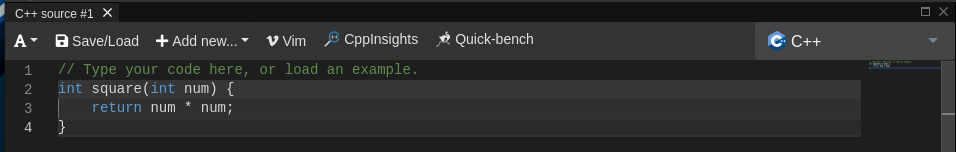
Then, choose a compiler (e.g., x86-64 gcc 12.1) to view the disassembly output.

The generated assembly shows stack setup (push, mov) and calculation using the imul instruction.
- Use -O2 or -O3 flags to see how optimizations affect assembly.
- Match functions by their symbol names or signatures.
- Recognize common compiler patterns, e.g., stack frame setup, register calling conventions, and return sequences (
pop rbp,ret).